Objective :
The aim of the project is to reconstruct with the greatest possible precision a landscape that can be observed in virtual flight as if from an aeroplane or helicopter. The applications are made up of two shells of information : (1) a terrain database which describes the relief of the studied area and (2) one or more textures which are draped over the terrain database and which are viewed during the virtual flight.
The terrain database is generated from Digital Elevation Models (DEMs), which are geographical databases describing the actual relief of an area. The DEMs are in the form of a regular grid having square cells whose points are known in terms of geographical and elevation coordinates. Several optimization techniques are implemented to allow virtual flights over large-sized databases.
The overlaid textures can be made up either of untreated aerial or satellite images, or processed images (classified in terms of land use, for example), or may correspond to geographical and environmental data that have been processed or produced by a Geographical Information System (GIS).
Thus, the aim is to enable the user of the geographical and environmental database to consult the information in virtual flight mode. A known flight altitude is chosen and the user is free to move virtually within this plane above the database. From the chosen flight altitude, the user can observe the database from any convenient angle of view. At any moment, the virtual flight altitude can be modified, but, in contrast to a flight simulator, there is no link between the viewing direction and the direction of flight.
In any given application used with the same terrain database, several textures are pre-loaded corresponding to different types of environmental information. During the flight, it is possible to switch instantaneously from one texture to another.
Finally, the user is not simply placed in the situation of an observer. He or she is able to make pinpoint interrogations of the geographical database. To achieve this, the user activates a graphical operator simulating a missile fired from the viewing point, which makes it possible to interrogate the database at the point targeted on the ground.
Originality of the project :
The main originality of the project concerns its field of application, that is to say, the environment.
The different advantages provided by virtual reality are used here to convey a relatively complex environmental message that, without such a presentation, would likely rebuff the user. We are able to derive maximum benefit from the great comfort of viewing (high-resolution images, fluidity of flight, stereoscopy, immersion, interactivity) in order to treat fairly difficult subject matter concerned with environmental trouble shooting and spatial modeling.
Some examples of applications:
The applications developed at the Digital Visualization Laboratory (Laboratoire de Spatialisation Numérique), involve several different spatial scales: the continent of Europe, France, the Brittany region and various catchment basins within the Brittany region.
The resolution of the terrain databases used here ranges from 500 m for applications concerning the European continent down to 20 m for applications in Brittany.
The textural resolution varies in parallel with the spatial resolution of the terrain databases, ranging from 500 m down to 2.5 m.
Several families of applications have been developed covering different types of environmental information to be conveyed, involving databases of variable size and resolution.
Applications using large geographical and environmental databases:
One of the aims of these digital simulations is to be able to carry out flights over large geographical and environmental databases in one continuous pass.
We have already implemented applications on textures attaining 256 million textels (160 x 160 km database using images with a resolution of 10 m at ground level), but even larger texture can be handled. An application using a virtual clipmap of 65 536 x 65 536 textels (i.e. more than 4 x 10⁹ textels) is in course of preparation.
To handle such databases,
optimization techniques should be put into operation for the management
of the terrain database as well as the textures.
2B. Project Illustrations
List of figures :
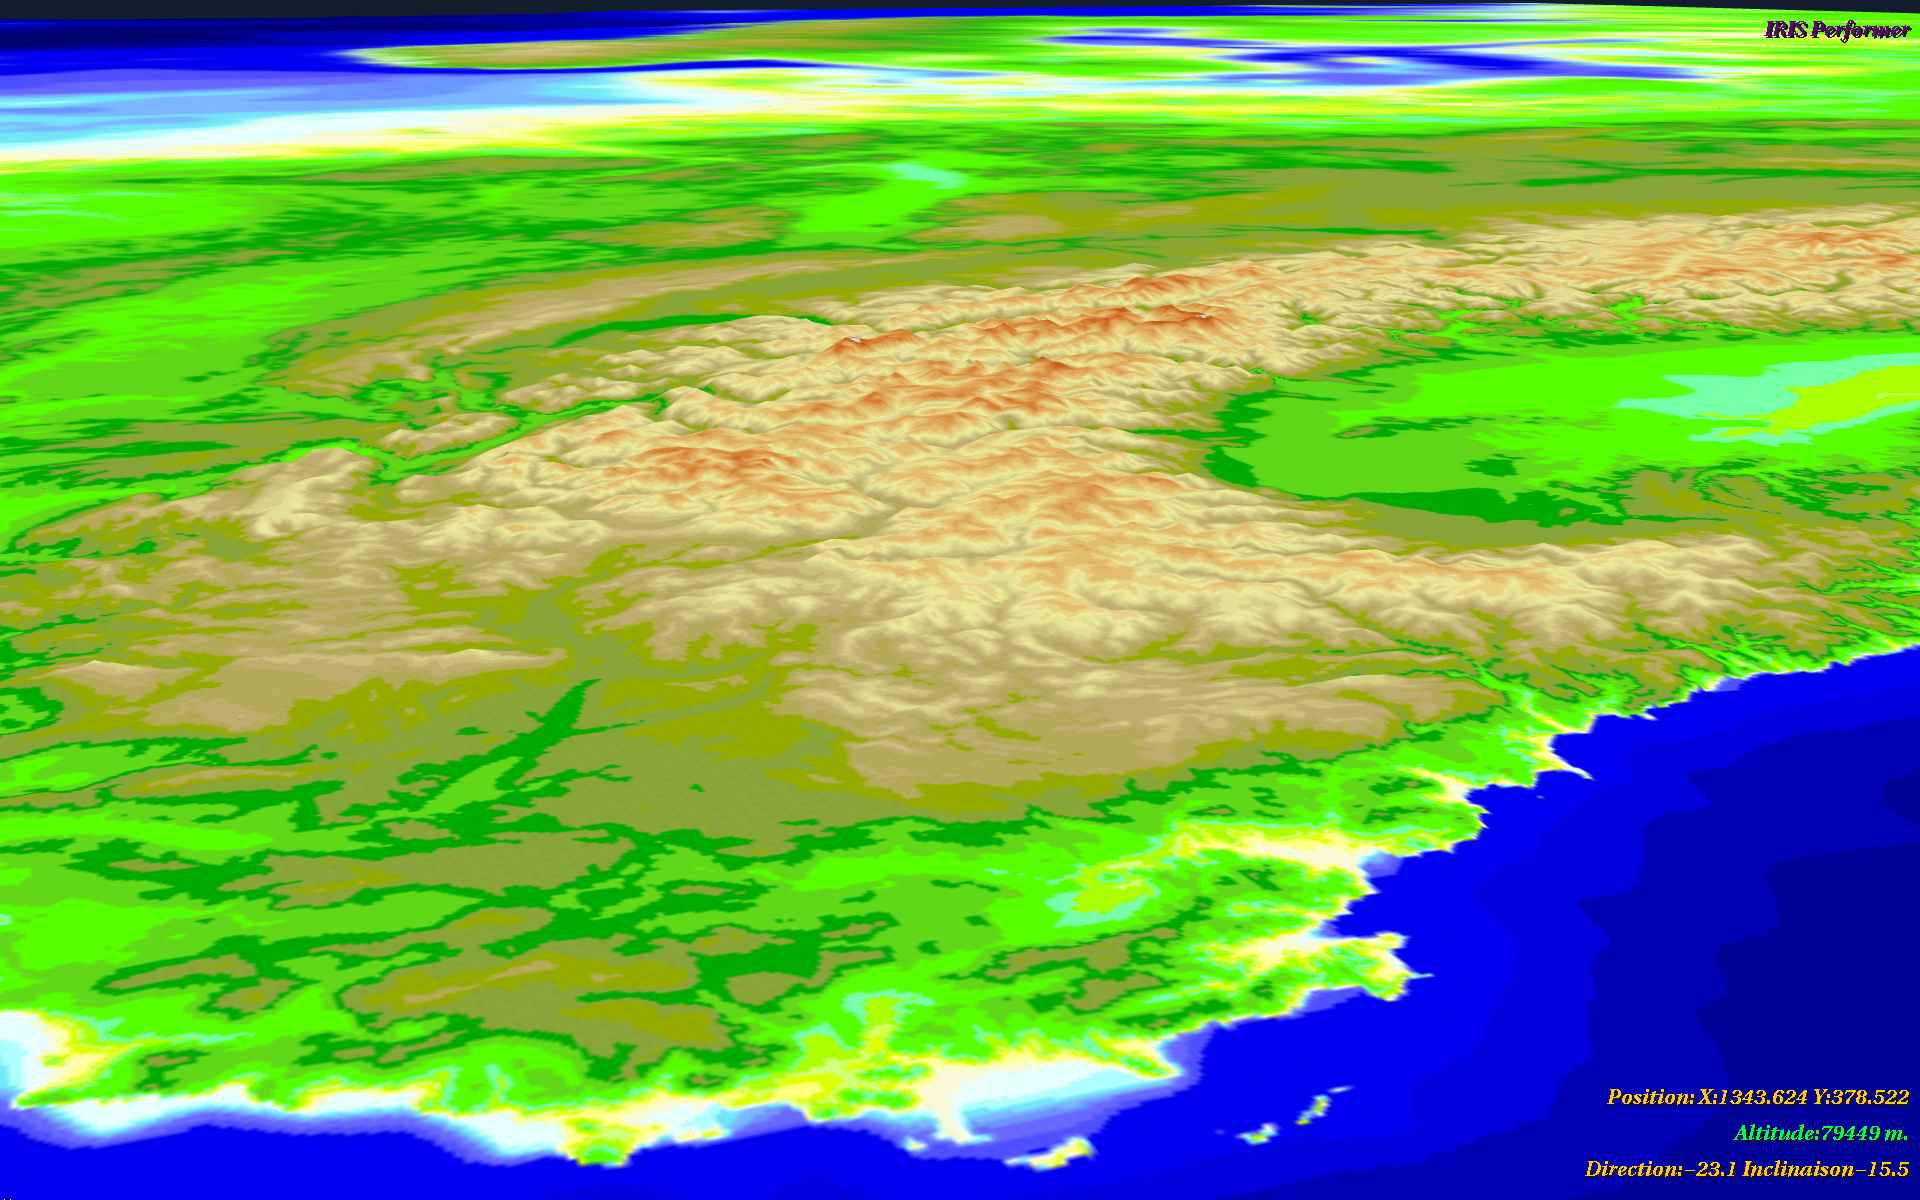
Figure 1 :
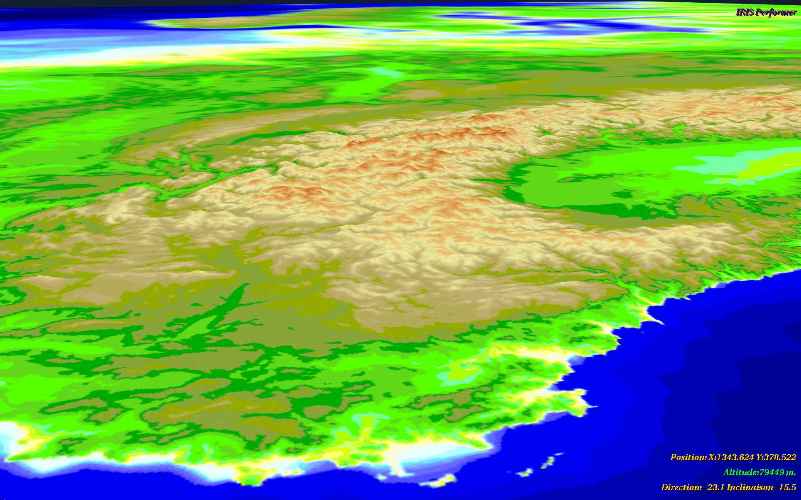
Image extracted from a virtual flight over Europe viewed towards the north from a point situated in the Mediterranean (the Alps in the foreground, the North Sea in the background on the left, Scandinavia in the center and the Baltic on the right). ( more details : 162K0)
The database is made up from a Digital Elevation Model with 500-m steps and a texture having 8192 x 8192 textels measuring 500 m on each side. Using a DEM of about 64 millions cells, a terrain database containing about 600 000 facets is generated by applying the Level of Detail and Active Surface Definition techniques. This database is established within the Corine Lambert Azimuthal geographical projection system of the European Community.
Geographical and environmental information to be conveyed: basic geographical map of Europe, with principal drainage networks and major catchment basins.
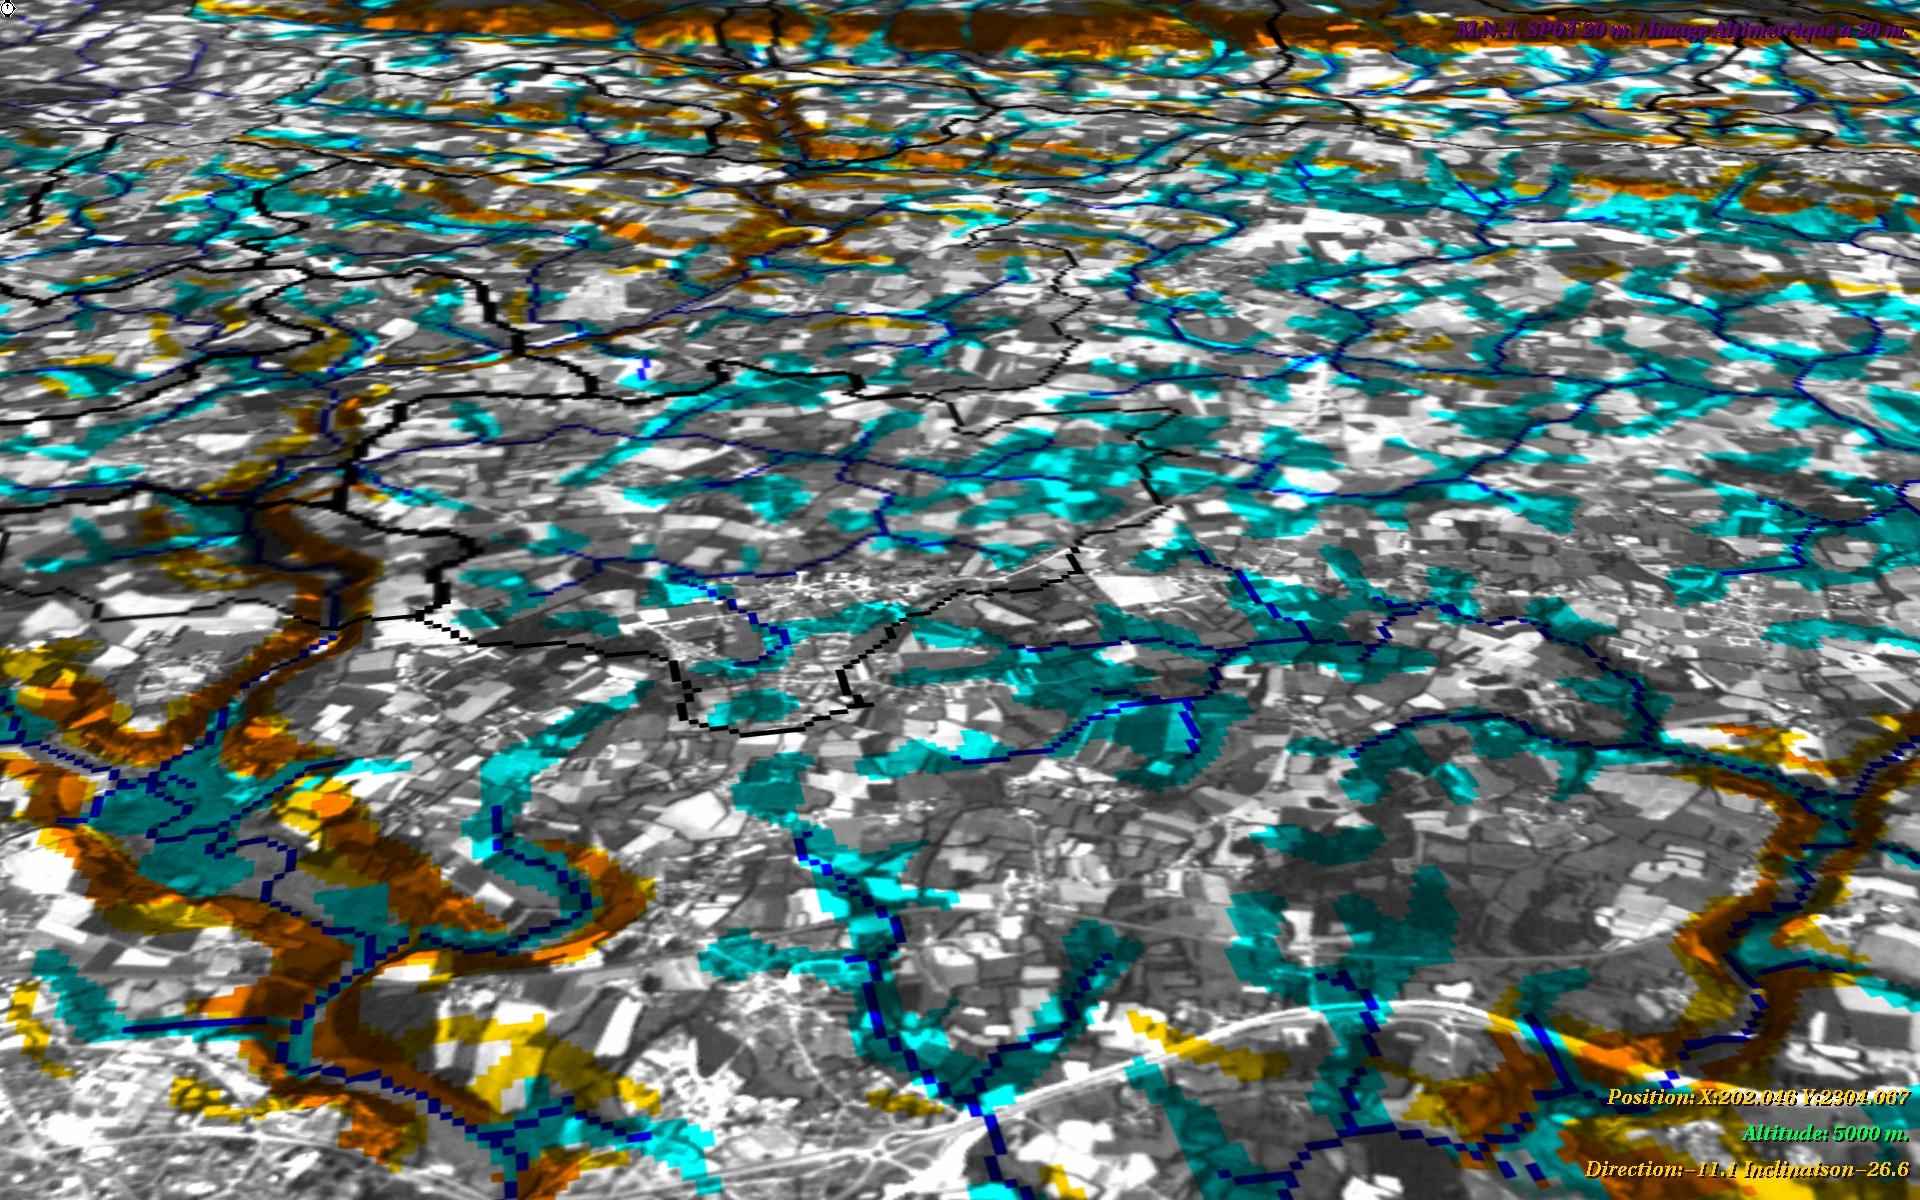
Figure 2 :
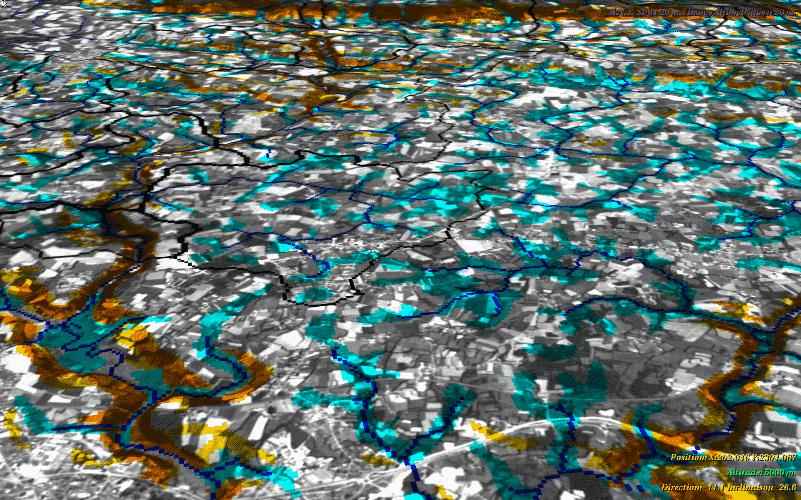
View of the Loc'h drainage basin. Image extracted from virtual flight over the Loc'h drainage basin (catchment area of about 30 000 ha draining into the western part of the Golfe du Morbihan near Auray : south of Brittany). The database is made up from a Digital Elevation Model with a 20-m step. The texture is formed of a panchromatic SPOT image with 4096 x 4096 textels measuring 10 m on each side, which is added to the color information composed of 1024 x 1024 textels measuring 40 m on each side derived from processing by a Geographical Information System. This database is established within the Lambert II geographical projection system. (more details : 264KO)
Geographical and environmental information to be conveyed: the drainage basin of the Loc'h and its division into sub-basins is in conformity with a network of points for water quality monitoring. Visualization of the drainage network is modeled by DEM processing. Also shown is the extent of water-saturated bottomlands, zones which are susceptible to denitrification processes (cf. role of these waterlogged zones in the transfer of pesticides and heavy metals) as well as the location of steeply sloping areas which are subject to runoff risks in terms of nitrogen, phosphorus and pesticides.
Figure 3 :
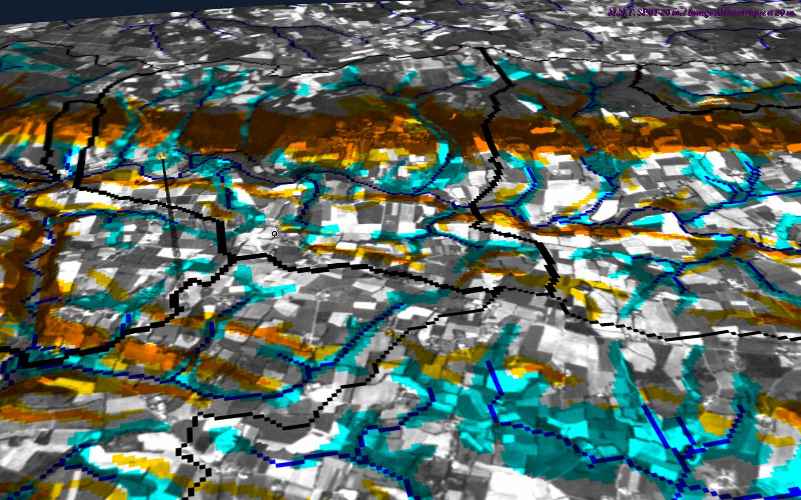
View of the Loc'h drainage basin in its upstream part near the Landes de Lanvaux. On the left is a graphic animation that allows the user to make pinpoint interrogations. (more details : 228 KO)
Figure 4 :
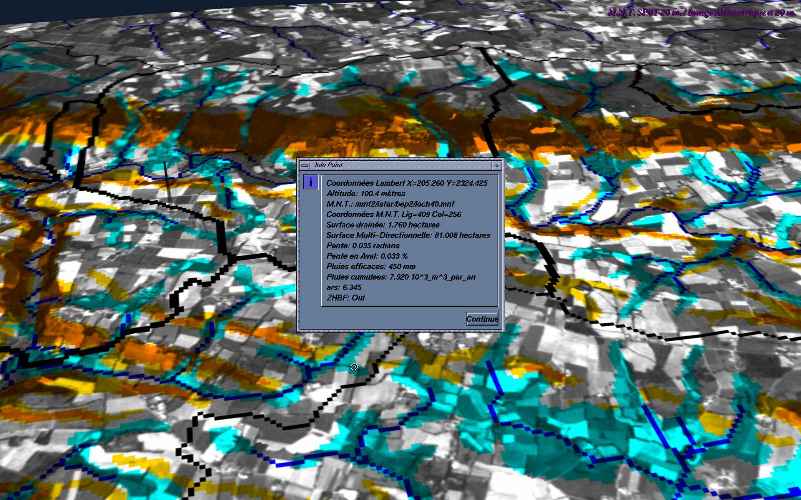
From the same viewing point as in Fig. 3, with graphic animation and display window used for showing results of pinpoint interrogation. (more details : 232KO)
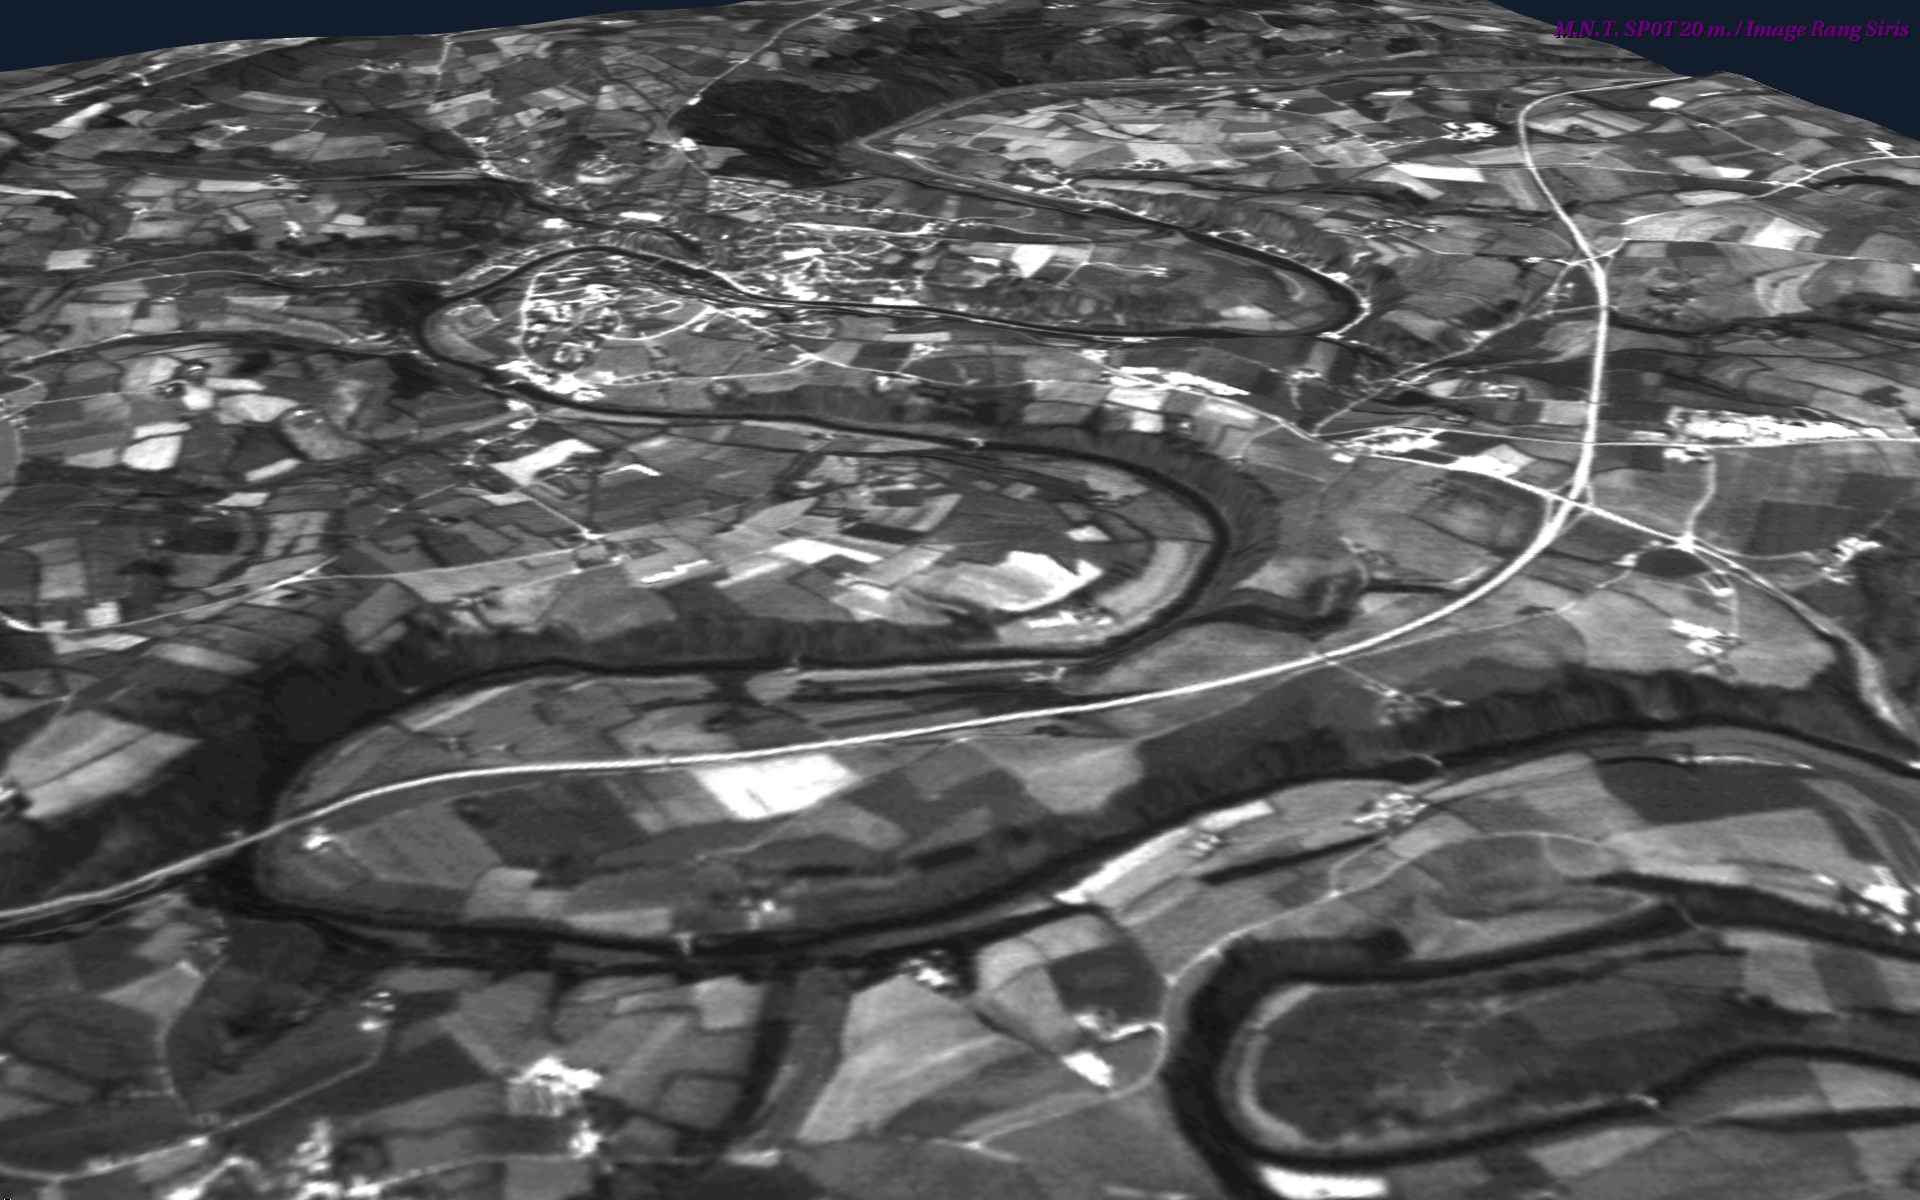
Figure 5 :
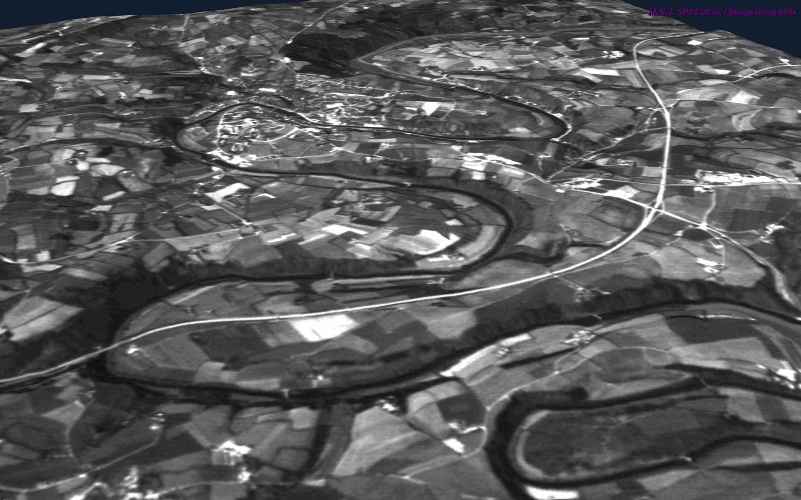
View of the Aulne drainage basin in the Chateaulin area (panchromatic SPOT image with 10-m resolution). The meanders of the Aulne River can be seen as well as the dual-carriageway road between Quimper and Brest, and, further in the distance, the town of Chateaulin. (more details : 160 KO)
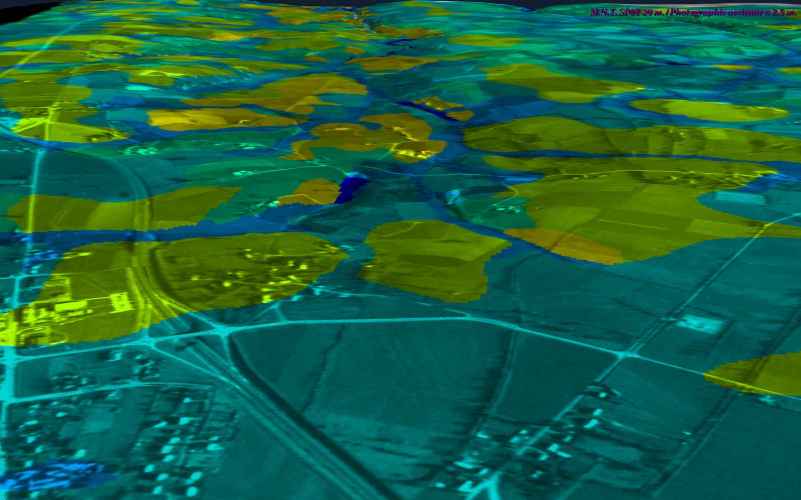
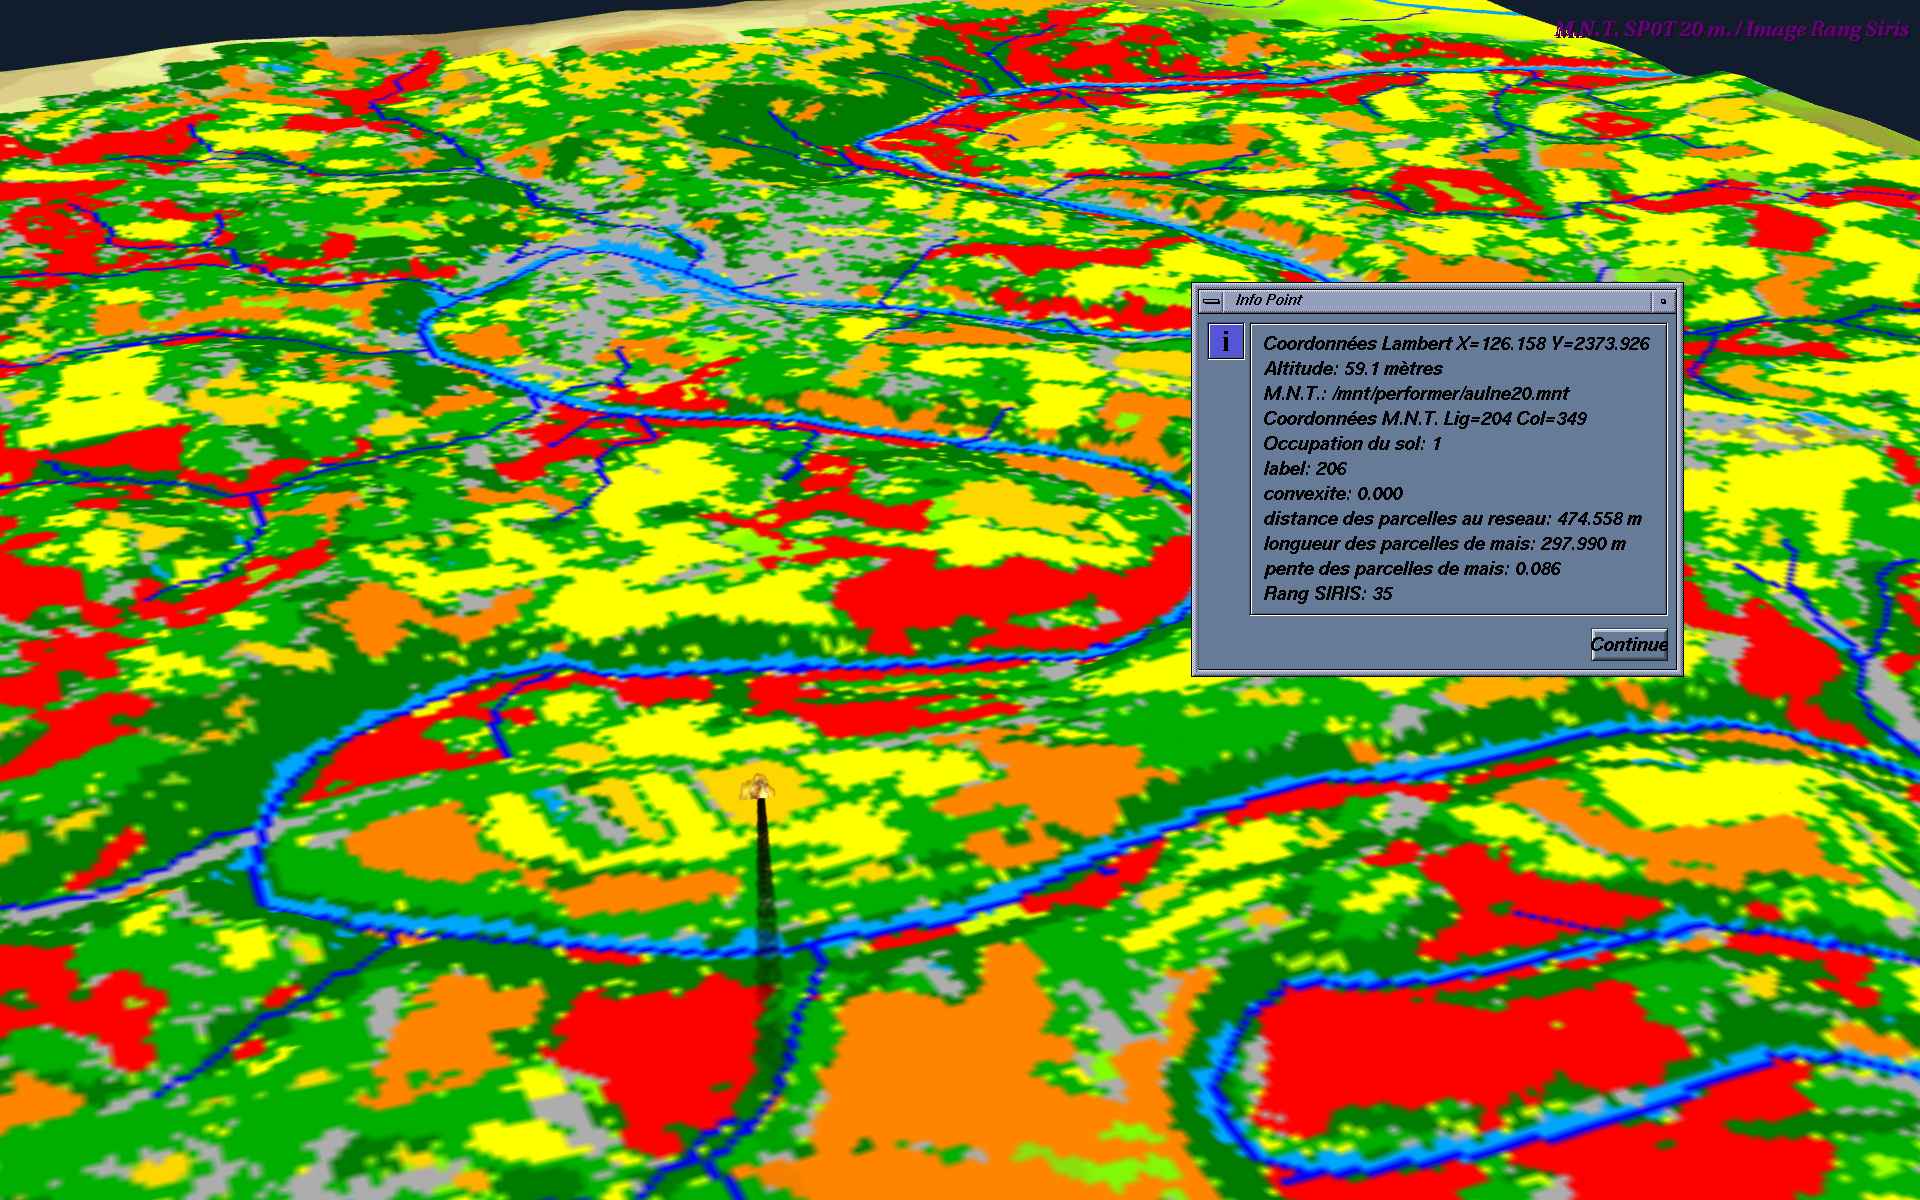
Figure 6 :
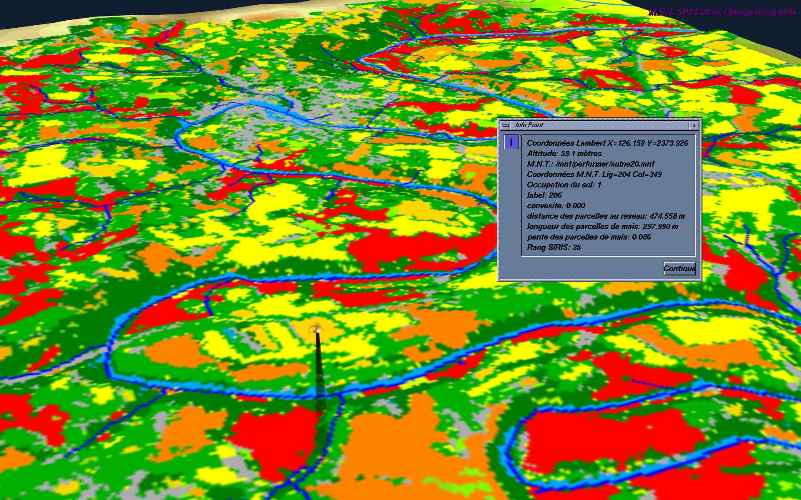
View of the Aulne drainage basin in the Chateaulin area (land use is shown using a texture made up of 20-m color pixels). Pinpoint interrogation is carried out on maize plot (land use code = 1) with a low risk of water contamination by pesticides (low order risk, SIRIS index = 28) displayed with light orange color code. (more details : 250 KO)
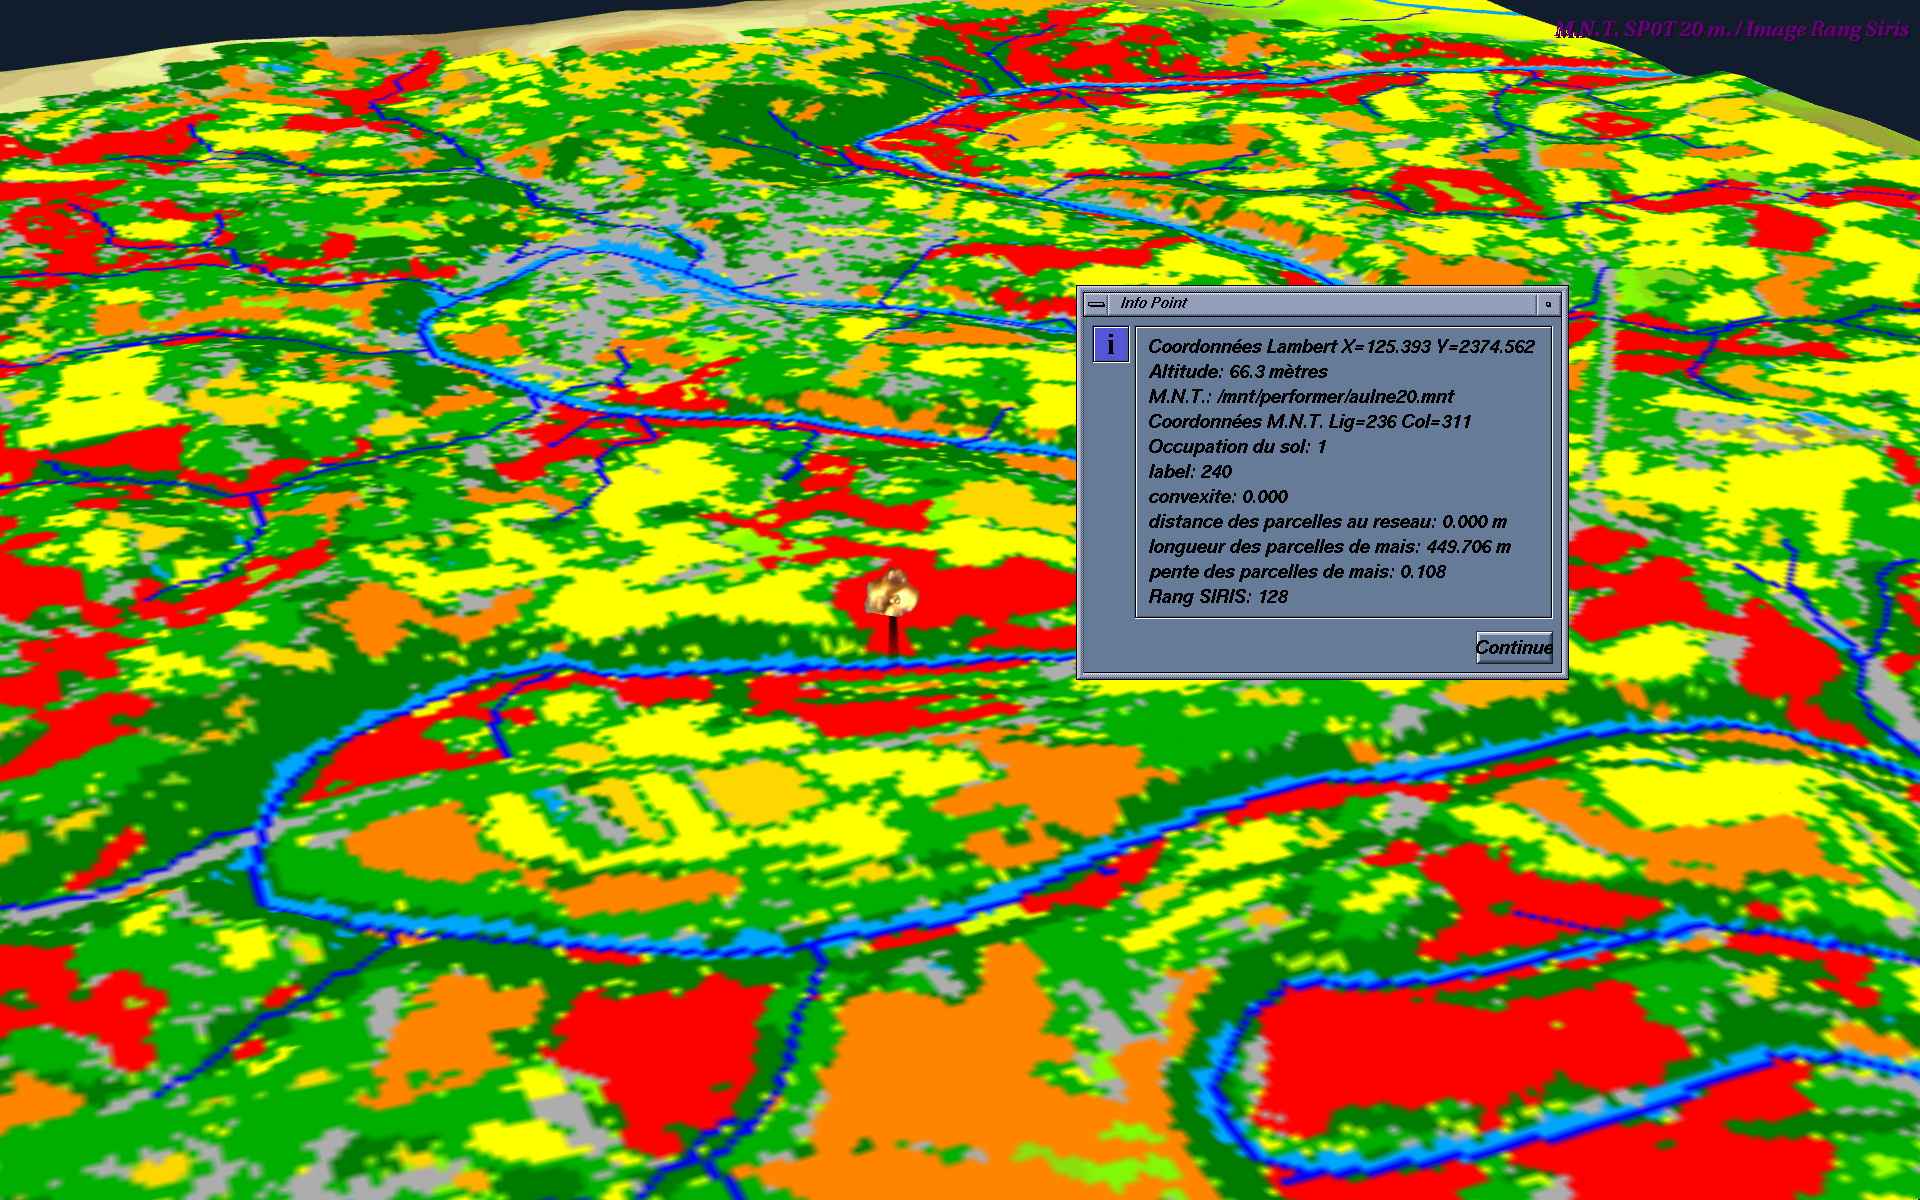
Figure 7 :
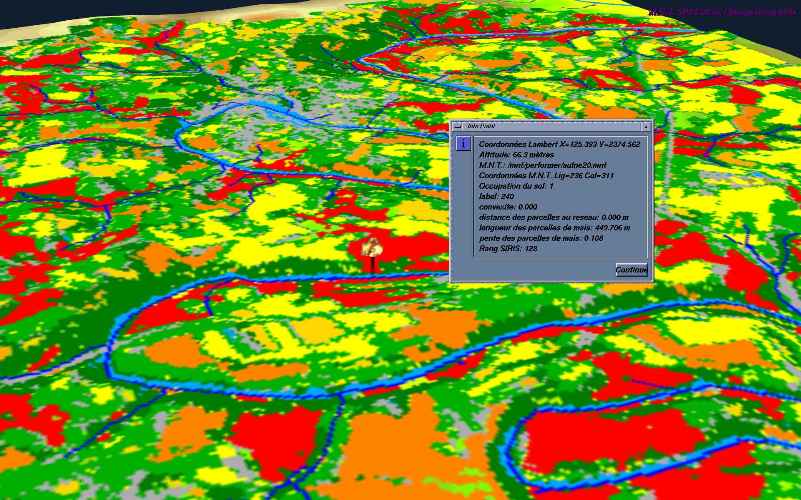
View of the Aulne drainage basin in the Chateaulin area (western part of Brittany) (land use is shown using a texture made up of 20-m color pixels). Pinpoint interrogation is carried out on maize plot (land use code = 1) with a high risk of water contamination by pesticides (high order risk, SIRIS index = 128) displayed with red color code. (more details : 250 KO)
Figure 8 :